
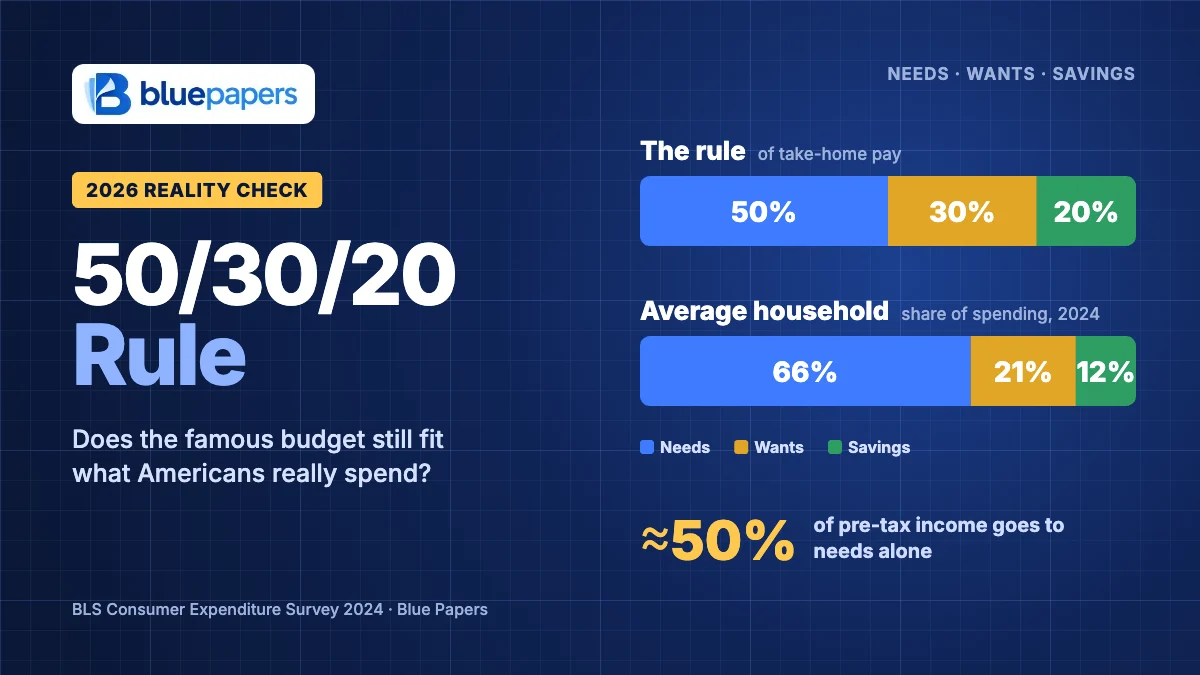
The 50/30/20 rule is the most popular budget in America for a good reason: it fits on a sticky note. Put 50% of your take-home pay toward needs, 30% toward wants and 20% toward savings. No apps, no categories, no tracking every coffee.
But the 50/30/20 rule was popularized by Elizabeth Warren and her daughter Amelia Warren Tyagi in their 2005 book All Your Worth, when rent, insurance and childcare cost far less relative to pay. So before you use it, it’s worth asking whether it still fits 2026 prices. I checked it against the latest federal spending data, ran it on a real-world budget, and compared it with how Australia and Korea build saving into every paycheck. Here’s what the 50/30/20 rule gets right, where it breaks, and a calculator that shows your own split in seconds. Think of the 50/30/20 rule as a starting line, not a finish line.
What’s in This Guide
What Is the 50/30/20 Rule?
The idea is to divide after-tax income into three buckets:
| Bucket | Share | What goes in it |
|---|---|---|
| Needs | 50% | Rent or mortgage, utilities, groceries, insurance, minimum debt payments, getting to work, basic childcare |
| Wants | 30% | Dining out, streaming, travel, hobbies, upgrades you could live without |
| Savings | 20% | Emergency fund, retirement, investing, and debt payments above the minimum |
The test for any expense is simple: if you stopped paying it, would your life or job fall apart? If yes, it’s a need. The gym membership, the newer phone and the premium grocery store are wants, even when they feel necessary.
Finding your real take-home number. Open your last two pay stubs and look at the net deposits. If you’re paid every two weeks, multiply one paycheck by 26 and divide by 12 instead of doubling it, because two months each year contain a third paycheck. Then add back pre-tax retirement and health savings contributions. For Maya, whom you’ll meet below, a biweekly deposit of about $2,290 works out to $4,962 a month, and adding back her $438 monthly 401(k) contribution brings her budget base to about $5,400.
The gray areas. Some costs don’t sort neatly, and how you classify them matters more than people think:
- Phone and internet: a basic plan is a need; the premium unlimited plan and the newest phone are wants.
- Groceries: the food you need is a need; specialty items and delivery fees are wants.
- Car: reliable transportation is a need; the gap between a $400 payment and a $750 one is a want.
- Pets: food and vet care are needs once you have the pet; grooming and extras are wants.
- Gifts and giving: most budgets treat these as wants, but if giving is a core value, give it its own line and shrink something else.
When in doubt, split the bill: put the basic version in needs and the upgrade in wants. That one habit tends to reveal where the money really goes.
Two details trip people up. First, use take-home pay, but add back anything already taken from your paycheck for a 401(k) or health savings account and count it as savings. Second, extra payments on credit cards belong in savings, because every dollar of high-rate debt you clear earns a guaranteed return.
Does the Average American Fit? We Checked the Data
The Bureau of Labor Statistics’ latest Consumer Expenditure Survey shows the average American household spent $78,535 in 2024 on an average pre-tax income of $104,207. I sorted every category into the three buckets:
| Bucket | Categories | Annual spending | Share of spending |
|---|---|---|---|
| Needs | Housing, transportation, groceries, healthcare | $52,005 | 66% |
| Wants | Dining out, entertainment, apparel, education, giving, other | $16,734 | 21% |
| Savings-like | Retirement contributions, pensions and Social Security, life insurance | $9,797 | 12% |
The needs bucket alone equals about 50% of the average household’s income before taxes. If taxes take 15% to 20% of that income, the same needs eat roughly 59% to 62% of take-home pay. In other words, the average household can’t hit the 50% target without changing something big, usually housing or transportation.
A fair caveat: the BLS housing category includes furniture and household supplies, and transportation includes new-car purchases, so some of that “needs” spending is really wants. Move those out and a typical household lands close to the 50% line, but with no room to spare. Housing alone took 33.4% of spending.
Averages also hide the spread. About half of US renter households are cost-burdened, meaning they spend more than 30% of their income on housing alone, according to Harvard’s Joint Center for Housing Studies. Homeowners with small or paid-off mortgages, on the other hand, can sit comfortably under 50% for all needs combined. Your own numbers matter more than any national benchmark.
The takeaway isn’t that the rule is broken. It’s that the 20% for savings is the part to protect, and the 50/30 line between needs and wants is the part you may have to bend. If your own needs run higher than 50%, you are in the majority, not failing.
Skip the 50/30/20 Rule Spreadsheet: Use This Calculator
Enter your monthly take-home pay and what you actually spend. The calculator compares your split with the target and tells you the one change that would matter most.
Use your monthly take-home pay: what lands in your account after taxes. Add 401(k) contributions back in if they come out of your paycheck.
| Bucket | 50/30/20 target | You | Difference |
|---|
Targets are 50% of take-home pay for needs, 30% for wants and 20% for savings. “Savings” includes retirement contributions, emergency fund deposits and payments above the minimum on debt. Estimates only. Nothing you enter leaves your browser.
When to Bend the Split
Here’s a real-world example. Maya, from our debt-to-income guide, earns $85,000 a year and takes home about $5,400 a month. Her budget:
| Bucket | Monthly | Share | Target |
|---|---|---|---|
| Needs (rent, car loan, student loan, card minimums, utilities, groceries, insurance, commute) | $3,800 | 70% | $2,700 |
| Wants | $900 | 17% | $1,620 |
| Savings | $700 | 13% | $1,080 |
She already spends less than the plan allows on wants, yet she still can’t save 20%. Cutting more fun money wouldn’t fix it. Her fixed costs are the problem. The best fix is to pay off her $450 car loan, using a debt payoff plan that suits her, and redirect that payment. Her needs then drop to $3,350 (62%) and savings rise to $1,150 (21%). She hits the savings goal without touching her wants.
If your fixed costs are high, try a 90-day reset before you give up on budgeting:
- Days 1–30: track every dollar, sorting each expense into the three buckets as you go. Don’t change anything yet.
- Days 31–60: attack the single biggest need that’s out of line, whether that means refinancing, renegotiating, switching insurers or selling a car you can’t afford.
- Days 61–90: set up an automatic transfer for your savings target on payday, even if it’s only 10% to start, and raise it by 1% of pay every month until you reach 20%.
Most people find the second month does the heavy lifting. One large fixed cost usually matters more than a dozen small wants. Write down the date you start, because seeing your before-and-after numbers side by side is the best motivation you will get.
That’s the pattern I’d follow: when needs run high, keep savings at 20% and let wants absorb the difference. A 60/20/20 split is a perfectly respectable budget. A few other variations:
- 60/20/20 for high-cost cities or families with childcare.
- 70/20/10 (living costs / savings / debt payoff or giving) if you want one simple spending number.
- Split by paycheck if you’re paid biweekly: apply the percentages to each deposit and send the two “extra” paychecks each year straight to savings.
- 80/20 (“pay yourself first”): automate 20% to savings on payday and spend the rest however you like. It’s the easiest way to budget like a pro without tracking categories.
Saving that starts before you budget. Living in Australia taught me how much a built-in savings rate changes the math. Australian employers must pay 12% of your salary into a retirement fund, called superannuation, on top of your pay, so a big chunk of saving happens before any budget begins. Korea’s National Pension takes 9.5% of pay in 2026, split between worker and employer, and that rate is scheduled to rise gradually to 13%. In the US, Social Security takes 6.2% from you and 6.2% from your employer, but it’s a benefit program, not an account you own. That’s why the 20% savings target matters more for Americans: much less saving is automatic here.
Before you pour everything into investing, fill your safety net. Our emergency fund calculator shows how much to set aside first, and our savings by age benchmarks show how you compare with households like yours. A clear split between wants and savings makes both of those goals easier to reach.
Frequently Asked Questions
Does the 50/30/20 rule actually work?
Yes, as a starting point. The 50/30/20 rule works best when your fixed costs are moderate. In expensive cities many households need 55% to 65% for needs, so keep savings at 20% and let wants shrink.
Is 50/30/20 or 70/20/10 better?
It depends on what you need more: structure or simplicity. The 70/20/10 approach lumps needs and wants together and still saves 20%, while the 50/30/20 rule forces you to separate them, which helps if spending creep is your weak spot.
How much should I save if I make $3,000 a month?
Under the 50/30/20 rule, $3,000 of take-home pay means $600 a month for savings, $1,500 for needs and $900 for wants. If your rent alone is over $1,000, start with 10% and raise it by 1% of pay every few months.
What is the 70-10-10-10 budget rule?
It puts 70% toward living expenses, 10% toward savings, 10% toward investing or debt payoff and 10% toward giving. It saves the same 20% as the 50/30/20 rule but adds a line for generosity.
How do I use the 50/30/20 rule with irregular income?
Build the budget on your lowest typical month, not your average. In better months, send the extra straight to savings or your emergency fund until it covers three to six months of needs.
So should you use it? Yes, as long as you treat the 20% as fixed and the 50 and 30 as flexible. The 50/30/20 rule is a compass, not a cage: point your money in the right direction, then adjust as your life changes. Run your own numbers in the calculator above and see where the 50/30/20 rule puts you today.
If you are still deciding
- How Much Rent Can I Afford?
- How Much to Save for Christmas
- Is a High-Yield Savings Account Worth It?
- How Much Should I Save for Retirement?
Updated September 26, 2026. Written by Jun, who is not a licensed financial advisor. BLS figures are 2024 averages across all US households. The example budget is illustrative. This article is for educational purposes only and is not financial advice.
Sources: Bureau of Labor Statistics, Consumer Expenditures 2024 (released December 2025) · Elizabeth Warren and Amelia Warren Tyagi, All Your Worth (2005) · Australian Taxation Office, Super guarantee rate · Korea National Pension Service, 2025 pension reform · Social Security Administration, payroll tax rates
Leave a Reply